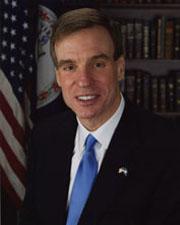
Warner's fundraising profile is dominated by individual donors, who account for 80 percent of his $14.8 million in direct contributions, with PACs and committees comprising 20 percent. Industry-tied contributions show notable concentration in Securities & Investment (23 percent), Lawyers & Lobbyists (17 percent), and Technology (9 percent), a pattern that aligns with the employment sectors of his individual donor base. Political party and leadership money totals $6.5 million separately from industry contributions.
Raised · all cycles$14.8M▲ 8% in ’24 vs ’22#22 in party · by cycle ↴
Top sector share23%Securities & Investment
Donor-sector votes11on bills touching top donor sectors
FOLLOW THE MONEY
Left: who funds Warner (ribbon width = dollars) · right: their votes on bills classified as favoring vs limiting those sectors
“Favors / limits” is an AI classification of each bill's likely effect on the sector — a factual reading of the bill, not a claim about motive. Correlation, not causation. The named bills are in DOES THE MONEY MATCH THE VOTES? below.
DOES THE MONEY MATCH THE VOTES?
How Warner voted on bills touching their biggest donor sectors · 6 of 11 shown, ranked by sector money
Each dollar figure is Warner's total from that donor sector — shown on each related vote, not a per-vote amount. Correlation between funding and votes, not causation; many factors shape any single vote.
War chest · cash on hand$14.6Mreported at the end of the last filing period
Burn rate · all cycles52¢spent per $1 of contributions raised
DONOR-SECTOR MOMENTUM
Monthly classified $ per top donor sector · ◆ = their vote on a bill touching that sector · recent months may lag FEC filings
Securities & Investment$2.1MLawyers & Lobbyists$1.3MTechnology$631KHealth Services$583K= their vote on a bill touching that sector
✓ YEA
S1582-119 — Guiding and Establishing National Innovation for U.S.
limits Securities & Investment · Jun ’25
✓ YEA
HJRES25-119 — This joint resolution nullifies the rule titled Gross Proceeds Reporting by Brokers That Regularly Provide Services Effectuating Digital Asset Sales a
favors Securities & Investment · Mar ’25
✕ NAY
SJRES28-119 — This joint resolution nullifies the final rule issued by the Consumer Financial Protection Bureau (CFPB) titled Defining Larger Participants of a Mark
favors Technology · Mar ’25
BY INDUSTRY
Share of classified money · the bar splits who gave it · hover for exact
Securities & Investment$2.6M23%
Individuals $2.2M · PACs $406K
Lawyers & Lobbyists$1.9M17%
Individuals $1.7M · PACs $229K
Technology$1.0M9%
Individuals $654K · PACs $353K
Health Services$802K7%
Individuals $441K · PACs $362K
Real Estate$647K6%
Individuals $544K · PACs $102K
Commercial Banks$638K6%
Individuals $320K · PACs $318K
IndividualsPACs
RECENT ACTIVITY
Most recent recorded contributions
TRELLIX PAC
PAC · May 28, 2026
+$5,000
CTIA - THE WIRELESS ASSOCIATION POLITICAL ACTION COMMITTEE
PAC · May 20, 2026
+$1,500
NATIONAL ASSOCIATION OF INSURANCE AND FINANCIAL ADVISORS POLITICAL ACTION COMM
PAC · May 19, 2026
+$2,500
THE FARM CREDIT COUNCIL POLITICAL ACTION COMMITTEE
PAC · Apr 30, 2026
+$2,000
THE FARM CREDIT COUNCIL POLITICAL ACTION COMMITTEE
PAC · Apr 30, 2026
+$1,500
ABELES, BARBARA (ABELES ASSOCIATES INC)
Individual · Apr 30, 2026
+$250
DEPUY, BILL (THE SEAMARSH GROUP, INC.)
Individual · Apr 30, 2026
+$500
DIXSON, DIANE (NOT EMPLOYED)
Individual · Apr 30, 2026
+$225
NUNEZ, DEBORAH (NUNEZ JEWELERSS INC)
Individual · Apr 30, 2026
+$500
PRIOR, LAWRENCE (THE CARLYLE GROUP)
Individual · Apr 30, 2026
+$500
SCHEER, SUZANNE (NOT EMPLOYED)
Individual · Apr 30, 2026
+$500
THORNE, STEPHEN (PDS HEALTH)
Individual · Apr 30, 2026
+$5,000
VANDERZON, JOHN (MYSELF)
Individual · Apr 30, 2026
+$1,250
CGI TECHNOLOGIES AND SOLUTIONS INC. PAC
PAC · Apr 29, 2026
+$4,000
NCTA - THE INTERNET & TELEVISION ASSOCIATION POLITICAL ACTION COMMITTEE (NCTAPAC)
PAC · Apr 29, 2026
+$2,500
MONUMENTAL SPORTS PAC
PAC · Apr 29, 2026
+$3,500
NATIONAL VENTURE CAPITAL ASSOCIATION VENTUREPAC
PAC · Apr 29, 2026
+$4,000
PINNACLE WEST CAPITAL CORPORATION PAC
PAC · Apr 29, 2026
+$2,500
PINNACLE WEST CAPITAL CORPORATION PAC
PAC · Apr 29, 2026
+$2,500
AVERY, MELA (SMALL BUSINESS)
Individual · Apr 29, 2026
+$250
BUCKNER, MICHEAL (UMWA HEALTH AND RETIREMENT FUNDS)
Individual · Apr 29, 2026
+$250
FITZPATRICK, JENNIFER (GOOGLE)
Individual · Apr 29, 2026
+$7,000
EZZELL, JACK L. (ZEELTECH)
Individual · Apr 29, 2026
+$200
HARRISON, DONALD (GOOGLE)
Individual · Apr 29, 2026
+$3,500
HARBECK, JUDITH (NOT EMPLOYED)
Individual · Apr 29, 2026
+$250
TOP SOURCES
Employers & PACs · excludes aggregators
Individuals · no employer listed$5.6M
1
MARK WARNER VICTORY FUND
PAC
$3.0M
2
ONE VIRGINIA FUND
PAC
$1.5M
3
MARK WARNER ACTION FUND
PAC
$1.3M
4
AMERICAN ISRAEL PUBLIC AFFAIRS COMMITTEE PAC
PAC
$253K
5
AT&T
employees
$143K
6
APOLLO GLOBAL MANAGEMENT
employees
$125K
7
GOLDMAN SACHS
employees
$100K
8
CAPITAL GROUP
employees
$98K
9
JUSTICE 2026
PAC
$97K
10
ONE VIRGINIA PAC
PAC
$86K
WHERE THE MONEY LIVES
Share of itemized contributions by the contributor's state
From VA (home state)38%
VA38%
NY15%
CA10%
DC7%
MD7%
Itemized FEC records only — sub-$200 small-dollar donors are not itemized by law and aren't included.
PARTY LOYALTY
90%
votes with the Democratic caucus · loyal
✓Yea 68✕Nay 46◦Present 0–Not Voting 0
ATTENDANCE
100.0%
missed 0 of 114 · tick = chamber median (97.8%)
KEY VOTES
Final-passage votes on tracked legislation · most recent first
The industries that fund Warner's campaign also pay lobbyists to influence the bills Warner votes on. This filters all lobbying filings down to those donor sectors.
200,108
overlapping filings
$28.5B
reported spend
8
donor industries
2017–2026
years covered
LOBBYING BY DONOR INDUSTRY
Bar = reported lobbying spend in each sector that also funds Warner
Defense & Aerospace · 62,495 filings$7.4B
Defense & Aerospace $7.4B · 62,495 filings
Health Services · 60,094 filings$6.4B
Health Services $6.4B · 60,094 filings
Securities & Investment · 25,207 filings$5.5B
Securities & Investment $5.5B · 25,207 filings
Technology · 26,599 filings$4.3B
Technology $4.3B · 26,599 filings
Commercial Banks · 10,548 filings$1.7B
Commercial Banks $1.7B · 10,548 filings
Insurance · 6,449 filings$1.5B
Insurance $1.5B · 6,449 filings
Real Estate · 7,476 filings$940.4M
Real Estate $940.4M · 7,476 filings
Legal Services · 1,240 filings$753.9M
Legal Services $753.9M · 1,240 filings
SPEND BY YEAR
TOP FIRMS
1
WASTE MANAGEMENT, INC.
9 filings
$1.0B
2
CHAMBER OF COMMERCE OF THE U.S.A.
18 filings
$307.6M
3
NATIONAL ASSOCIATION OF REALTORS
16 filings
$230.1M
4
PHARMACEUTICAL RESEARCH AND MANUFACTURERS OF AMERICA
17 filings
$137.6M
5
AMERICAN MEDICAL ASSOCIATION
18 filings
$108.8M
6
THE BUSINESS ROUNDTABLE, INC.
17 filings
$102.3M
7
AMERICAN HOSPITAL ASSOCIATION
17 filings
$90.3M
8
SOUTHERN COMPANY
28 filings
$88.0M
ESTIMATED HOLDINGS
~$108.2M
disclosed range $36.1M–$180.3M
$84.9M
volume traded
194
trades
▲ 86
buys
▼ 59
sells
6
issuers
60
filings
The big figure is the estimated current portfolio; volume traded is how much was bought/sold in the window — different things. Holdings start from his 2024 annual disclosure, rolled forward by trades since · midpoint of a wide disclosed range.
TRADING ACTIVITY
Buys ▲ above the line · sells ▼ below · every bar labeled
⤓ axis clipped so the outlier doesn't flatten every other bar — slashed bars exceed the scale; their labels show the true amount
▲ Buys▼ Sells
HOLDINGS
Disclosed positions, adjusted for trades since the last annual filing
—Hawthorne EB North Rivers, LLCAug 12, 2019Jul 3, 201940d▼ Sell$500K–$1.0M
ZAYOZayo Group Holdings, Inc.Mar 8, 2019Feb 20, 201916d▼ Sell$250K–$500K
—Zayo Group Holdings, Inc.Feb 20, 2019Feb 20, 20190d▼ Sell$250K–$500K
Showing 100 of 194 — narrow the window to see more.
HOW WE ESTIMATE THIS
Estimated holdings start from the 2024 annual financial disclosure (each stock listed as a value range), rolled forward by trades disclosed since.
Everything is a range or estimate. The STOCK Act requires only broad dollar brackets (e.g. "$1,001–$15,000"), never exact amounts, share counts, or prices. Figures shown are midpoints.
"Filed after" is the gap between the trade and its disclosure. Over 45 days (⚠) is outside the STOCK Act's filing window.
Source. U.S. House Clerk periodic transaction reports & annual financial disclosures (public record). Not real-time; profit/loss can't be computed from disclosures.