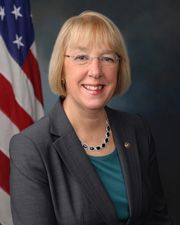
Senator Murray's fundraising profile is heavily weighted toward PACs and committees, which account for 64 percent of her $11.2 million total, with an additional $2.4 million coming from party and leadership sources. Industry-tied contributions show donor concentration in health services, labor unions, legal services, pharmaceuticals, and technology sectors, with individual donors employed primarily in law, finance, and technology fields. Her voting record includes 113 recorded votes, and she has disclosed 161 stock trades under the STOCK Act.
Based on FEC donor data and voting records. Statistical patterns only — does not imply causation.
FUNDING PROFILE
Where the money comes from · what it's tied to
WHO GAVE IT
$11.2M raised
PACs & committees$7.1M· 64%
Individuals$4.1M· 36%
+ $1.8Mvia pass-through platforms (ActBlue/WinRed/party) — not counted in “raised”
WHAT IT'S TIED TO
Industry-tied$4.6M· 41%
Party & political$2.4M· 21%
Untraced (small donors)$4.3M· 38%
Two views of the same $11.2M — who gave it vs whatit's tied to. (Most industry money comes from PACs, so the two don't add together.)
Top sectors: Health Services, Labor Unions, Lawyers & Lobbyists
Trades: STOCK Act disclosures · live ingestion rebuilding
117th–119th Congress. Statistical patterns only.
FUNDING PROFILE
Source breakdown · industry signal · political money — shown separately
WHO GAVE IT
$11.2M raised
PACs & committees$7.1M· 64%
Individuals$4.1M· 36%
+ $1.8Mvia pass-through platforms (ActBlue/WinRed/party) — not counted in “raised”
WHAT IT'S TIED TO
Industry-tied$4.6M· 41%
Party & political$2.4M· 21%
Untraced (small donors)$4.3M· 38%
Two views of the same $11.2M — who gave it vs whatit's tied to. (Most industry money comes from PACs, so the two don't add together.)
INDUSTRY SIGNAL
The $4.6M industry-tied portion, by sector
$4.6M
industry-tied
Other sectors38.8%
Health Services12.1%
Labor Unions10.1%
Lawyers & Lobbyists9.7%
Pharmaceuticals & Biotech8.0%
Technology7.5%
Defense & Aerospace6.9%
Insurance6.8%
PARTY & POLITICAL
The $2.4Mparty/leadership & single-cause portion — not an industry signal
Party & Leadership$1.6M
Single-Issue Advocacy$813K
How to read this: “Raised” is direct contributions ($11.2M). We trace it to an industry or political category via PAC names and donor employers; small online donors without an employer can't be traced. Industry and political money are shown separately so the economic-interest signal isn't drowned out by party and advocacy money.
“Raised” counts direct contributions from PACs and itemized individual donors. The Industry Signal donut shows only money traceable to an economic sector (via PAC names and donor employers); its center dollar figure always equals the sum of its slices. Party, leadership, and single-issue money is shown separately as political money, not industry — so it can't distort the economic-interest picture.
What we exclude from “raised”
FEC memo entries (informational subtotals that double-count money already reported elsewhere) are excluded — counting them inflated totals by tens of millions per member. Pass-through platforms (WinRed/ActBlue) that bundle many small donors are also shown apart from raised totals to avoid double-counting.
Data sources
FEC Schedule A & bulk PAC filings · 2022–2026 cycles · Lobbying Disclosure Act (LDA) filings · 2017–present · Congress.gov / House Clerk voting records.
Important disclaimer
All data is sourced from public records. Analysis reflects statistical patterns only — it does not imply corruption, intent, or quid pro quo. Donor relationships show financial alignment, not control. Capitol Trail makes no claims about the motivations or character of any individual or organization.
VOTE TIMELINE
61 YEA · 51 NAY · 113 tracked
202120222023202420252026
Each dot = one tracked vote. ↑ YEA · ↓ NAY. Click to jump to the bill.
VOTING RECORD
Final passage votes on tracked legislation · Votes with Democrats 93% of the time
We're migrating to a fresh data source for daily STOCK Act disclosures. Historical filings shown below are accurate but not currently refreshed nightly. Full real-time coverage returning shortly.
161
disclosures
17
purchases
83
sales
2
est. positions
ESTIMATED CURRENT HOLDINGS
Net long positions · derived from PTR ledger
TickerAssetEst. rangeLast tradeTrades
—Marsh & McLennan Companies, Inc.$1K–$15KMar 16, 171
—Foot Locker, Inc.$1K–$15KMar 16, 171
Estimated from purchases minus sales since 2013. Disclosure ranges (e.g. "$1,001–$15,000") are wide by design — positions are approximate. Not investment advice. Closed positions are excluded.
TRADE LEDGER
100 recent trades shown
AssetTypeAmountTrade dateChamber
The Williams Companies, Inc.Sale (Full)$1K–$15KJun 15, 17SEN
WestRock CompanySale (Full)$1K–$15KJun 15, 17SEN
Wells Fargo & CompanySale (Full)$1K–$15KJun 15, 17SEN
Walgreens Boots Alliance, Inc.Sale (Full)$1K–$15K
+61 unparsed PTRs — Some older PTR filings exist as metadata only (asset details locked in PDFs). They are not included in the holdings estimate above. House-side parsing landing in a future update.
DATA SOURCES
House: housestockwatcher.com · daily-refreshed PDF parses · 2013–present
Senate: senatestockwatcher.com · daily-refreshed PDF parses · 2013–present
Required under the STOCK Act of 2012. Disclosure regime reports amount ranges, not exact share counts.
Lobbying is when companies, unions, and trade associations pay firms to influence laws and regulations — and the law requires them to disclose it. Every quarter, registrants file a report with Congress detailing who hired them, how much they spent, and which issues they pushed.
This page filters those filings to the industries that also fund this member's campaign. If commercial banks gave 30% of this member's donations and also filed 5,000 lobbying reports on bank-related issues last year, that's a financial pattern worth knowing about. It does not mean the member is corrupt — it means the industries paying to elect them are also paying to influence the laws they vote on.
140,894
Lobbying filings
that overlap top donor industries
$20.1B
Reported spend
across those filings
8
Donor industries
tracked here
2017–2026
Years covered
10 years
LOBBYING BY DONOR INDUSTRY
only industries that also fund this member
Each row = an industry that donated to this member AND has lobbyists pushing on Congress. Bar width = reported lobbying spend.
Defense & Aerospace
48,778 filings$6.0B
Health Services
46,475 filings$4.9B
Securities & Investment
19,298 filings$4.2B
Technology
20,580 filings$3.3B
TOP LOBBYING FIRMS
The firms doing the most spending in this member's donor industries
#1
WASTE MANAGEMENT, INC.
6 filings
$1.0B
#2
CHAMBER OF COMMERCE OF THE U.S.A.
14 filings
$242.0M
#3
NATIONAL ASSOCIATION OF REALTORS
12 filings
$159.5M
#4
PHARMACEUTICAL RESEARCH AND MANUFACTURERS OF AMERICA
13 filings
$113.6M
#5
AMERICAN MEDICAL ASSOCIATION
14 filings
$91.7M
#6
Insurance
4,832 filings$1.2B
Legal Services
931 filings$571.0M
LOBBYING SPEND BY YEAR
How much lobbyists in this member's donor industries have reported spending each year
Amounts are self-reported by registrants. Issue codes are mapped from the LDA's 80+ general issue codes to our 19-industry taxonomy.
An industry showing up here means it both (a) funds this member's campaign and (b) lobbies Congress on issues affecting it. That overlap is a factual pattern, not proof of any quid-pro-quo.