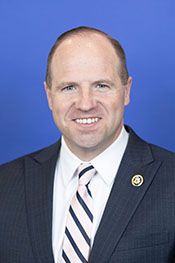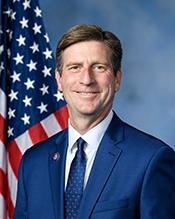
Stanton's $9.1M fundraising profile relies more heavily on individual donors (70%) than PACs and committees (30%), with nearly $520K in separate party and leadership contributions. Industry-tied money concentrates in Lawyers & Lobbyists (22% of industry funds), Health Services (10%), and Securities & Investment (8%), a pattern reinforced by his individual donor base, which similarly draws from legal, healthcare, and financial services professionals. Over his voting record of 336 recorded votes, Stanton has disclosed 190 stock trades under the STOCK Act.
Raised · all cycles$13.4M▼ 35% in ’24 vs ’22#42 in party · by cycle ↴
Top sector share22%Lawyers & Lobbyists
Donor-sector votes9on bills touching top donor sectors
FOLLOW THE MONEY
Left: who funds Stanton (ribbon width = dollars) · right: their votes on bills classified as favoring vs limiting those sectors
“Favors / limits” is an AI classification of each bill's likely effect on the sector — a factual reading of the bill, not a claim about motive. Correlation, not causation. The named bills are in DOES THE MONEY MATCH THE VOTES? below.
DOES THE MONEY MATCH THE VOTES?
How Stanton voted on bills touching their biggest donor sectors · 6 of 9 shown, ranked by sector money
Each dollar figure is Stanton's total from that donor sector — shown on each related vote, not a per-vote amount. Correlation between funding and votes, not causation; many factors shape any single vote.
TOP SOURCES
1
HMP
PAC
$172K
2
UNITED WE CAN
PAC
$98K
3
PERKINS COIE
employees
$65K
4
SNELL & WILMER
employees
$52K
5
SEIU COPE (SERVICE EMPLOYEES INTERNATIONAL UNION COMMITTEE ON POLITICAL EDUCATION)
War chest · cash on hand$2.0Mreported at the end of the last filing period
Burn rate · all cycles90¢spent per $1 of contributions raised
DONOR-SECTOR MOMENTUM
Monthly classified $ per top donor sector · ◆ = their vote on a bill touching that sector · recent months may lag FEC filings
Lawyers & Lobbyists$714KHealth Services$270KSecurities & Investment$224KLabor Unions$222K= their vote on a bill touching that sector
✓ YEA
S1582-119 — Guiding and Establishing National Innovation for U.S.
limits Securities & Investment · Jul ’25
✓ YEA
HJRES25-119 — This joint resolution nullifies the rule titled Gross Proceeds Reporting by Brokers That Regularly Provide Services Effectuating Digital Asset Sales a
favors Securities & Investment · Mar ’25
BY INDUSTRY
Share of classified money · the bar splits who gave it · hover for exact
Lawyers & Lobbyists$1.6M22%
Individuals $1.5M · PACs $103K
Health Services$686K10%
Individuals $619K · PACs $67K
Securities & Investment$591K8%
Individuals $552K · PACs $39K
Labor Unions$568K8%
Individuals $7K · PACs $561K
Real Estate$561K8%
Individuals $482K · PACs $79K
Technology$437K6%
Individuals $354K · PACs $83K
IndividualsPACs
RECENT ACTIVITY
Most recent recorded contributions
CONANT, PAUL (SELF EMPLOYED)
Individual · Jul 1, 2026
+$3,500
CONANT, MARY (CONANT LAW FIRM)
Individual · Jul 1, 2026
+$3,500
HERMAN, MAURY (NOT EMPLOYED)
Individual · Jul 1, 2026
+$2,000
THELANDER, DAN (DAN THELANDER)
Individual · Jul 1, 2026
+$1,000
RICHARDS, KEVIN (SAP)
Individual · Jul 1, 2026
+$500
READ, JONATHAN R (NOT EMPLOYED)
Individual · Jul 1, 2026
+$500
DAVIS, DONNA (DIR GROUP INC.)
Individual · Jul 1, 2026
+$500
THOMPSON, ZACK (SALT RIVER PROJECT)
Individual · Jul 1, 2026
+$250
STATON, GEORGIA (JONES SKELTON & HOCHULI)
Individual · Jul 1, 2026
+$250
BLOOMBERG, ROBERT (ROBERT BLOOMBERG MD)
Individual · Jul 1, 2026
+$250
STOWE, JO (NOT EMPLOYED)
Individual · Jul 1, 2026
+$100
KNIGHT, GAIL (NOT EMPLOYED)
Individual · Jul 1, 2026
+$100
SUNDLOF, KENNETH C. JR (SELF EMPLOYED)
Individual · Jul 1, 2026
+$50
NILSSON, THOMAS (SUMITOMO)
Individual · Jul 1, 2026
+$50
ALSOP, JOSEPH (ALSOP LOUIE PARTNERS)
Individual · Jun 30, 2026
+$3,500
KELLY, THOMAS (NOT EMPLOYED)
Individual · Jun 30, 2026
+$3,116
INGRAM, SHEILA (NOT EMPLOYED)
Individual · Jun 30, 2026
+$3,000
HUELLMANTEL, CHARLES (SELF EMPLOYED)
Individual · Jun 30, 2026
+$2,500
TALBOT-STERN, JUSTIN (NOT EMPLOYED)
Individual · Jun 30, 2026
+$1,000
SLAVIN, FRANCIS (SELF EMPLOYED)
Individual · Jun 30, 2026
+$1,000
SINGH, HARINDER (SELF EMPLOYED)
Individual · Jun 30, 2026
+$1,000
O'BRIEN, DANIEL (O'BRIEN GLOBAL ADVISORS)
Individual · Jun 30, 2026
+$1,000
KING, JOHN (NASHVILLE MANAGEMENT INC)
Individual · Jun 30, 2026
+$1,000
GONZALEZ, JOHN MICHAEL (TIBER CREEK GROUP)
Individual · Jun 30, 2026
+$1,000
AGUIRRE, AMANDA (REGIONAL CENTER FOR BORDER HEALTH INC.)
Individual · Jun 30, 2026
+$1,000
TOP SOURCES
Employers & PACs · excludes aggregators
Individuals · no employer listed$3.5M
1
HMP
PAC
$172K
2
UNITED WE CAN
PAC
$98K
3
PERKINS COIE
employees
$65K
4
SNELL & WILMER
employees
$52K
5
SEIU COPE (SERVICE EMPLOYEES INTERNATIONAL UNION COMMITTEE ON POLITICAL EDUCATION)
PAC
$49K
6
CYBERITAS TECHNOLOGIES LLC
employees
$42K
7
SNELL & WILMER L.L.P.
employees
$41K
8
AXON
employees
$41K
9
RED DEVELOPMENT
employees
$39K
10
ASU
employees
$39K
WHERE THE MONEY LIVES
Share of itemized contributions by the contributor's state
From AZ (home state)80%
AZ80%
CA7%
DC2%
NY2%
MA1%
Itemized FEC records only — sub-$200 small-dollar donors are not itemized by law and aren't included.
PARTY LOYALTY
98%
votes with the Democratic caucus · loyal
✓Yea 298✕Nay 36◦Present 0–Not Voting 2
ATTENDANCE
99.4%
missed 2 of 336 · tick = chamber median (98.1%)
KEY VOTES
Final-passage votes on tracked legislation · most recent first
The industries that fund Stanton's campaign also pay lobbyists to influence the bills Stanton votes on. This filters all lobbying filings down to those donor sectors.
180,893
overlapping filings
$27.3B
reported spend
8
donor industries
2017–2026
years covered
LOBBYING BY DONOR INDUSTRY
Bar = reported lobbying spend in each sector that also funds Stanton
Health Services · 89,978 filings$9.7B
Health Services $9.7B · 89,978 filings
Securities & Investment · 37,018 filings$8.3B
Securities & Investment $8.3B · 37,018 filings
Technology · 40,692 filings$6.7B
Technology $6.7B · 40,692 filings
Real Estate · 11,408 filings$1.5B
Real Estate $1.5B · 11,408 filings
Legal Services · 1,797 filings$1.1B
Legal Services $1.1B · 1,797 filings
SPEND BY YEAR
TOP FIRMS
1
CHAMBER OF COMMERCE OF THE U.S.A.
28 filings
$498.2M
2
NATIONAL ASSOCIATION OF REALTORS
25 filings
$386.5M
3
PHARMACEUTICAL RESEARCH AND MANUFACTURERS OF AMERICA
25 filings
$191.4M
4
THE BUSINESS ROUNDTABLE, INC.
28 filings
$171.3M
5
AMERICAN MEDICAL ASSOCIATION
29 filings
$154.7M
6
AMERICAN HOSPITAL ASSOCIATION
25 filings
$135.4M
7
AMAZON.COM SERVICES LLC
28 filings
$118.6M
8
META PLATFORMS, INC. AND VARIOUS SUBSIDIARIES
26 filings
$118.6M
ESTIMATED HOLDINGS
~$192K
disclosed range $0–$385K
$1.8M
volume traded
190
trades
▲ 93
buys
▼ 97
sells
95
issuers
4
filings
The big figure is the estimated current portfolio; volume traded is how much was bought/sold in the window — different things. Holdings start from his 2024 annual disclosure, rolled forward by trades since · midpoint of a wide disclosed range.
TRADING ACTIVITY
Buys ▲ above the line · sells ▼ below · every bar labeled
▲ Buys▼ Sells
HOLDINGS
Disclosed positions, adjusted for trades since the last annual filing
TICKERCOMPANYSECTOREST. VALUE
TCNNFTRULIEVE CANNABIS CORPOther~$192K
MOST TRADED
By trade count · the number in each segment = buys / sells · $ = summed disclosed range
Showing 100 of 190 — narrow the window to see more.
HOW WE ESTIMATE THIS
Estimated holdings start from the 2024 annual financial disclosure (each stock listed as a value range), rolled forward by trades disclosed since.
Everything is a range or estimate. The STOCK Act requires only broad dollar brackets (e.g. "$1,001–$15,000"), never exact amounts, share counts, or prices. Figures shown are midpoints.
"Filed after" is the gap between the trade and its disclosure. Over 45 days (⚠) is outside the STOCK Act's filing window.
Source. U.S. House Clerk periodic transaction reports & annual financial disclosures (public record). Not real-time; profit/loss can't be computed from disclosures.