
THE TAKETrailAI · auto-generated
Crawford's fundraising profile is heavily weighted toward PACs and committees, which account for 62 percent of his $3.1 million total, with the remaining 38 percent coming from individual donors. Industry-tied contributions show a pronounced concentration in agriculture (24 percent of industry money), followed by transportation (13 percent) and construction and engineering (11 percent), a pattern that aligns with the sectors represented among his individual donors, which include agriculture, health services, and construction and engineering. His campaign finance composition reflects substantial reliance on organized committee funding alongside donor bases concentrated in extractive and infrastructure-related industries.
Raised · all cycles$3.1M▼ 2% in ’24 vs ’22#164 in party · by cycle ↴
Top sector share24%Agriculture
Donor-sector votes16on bills touching top donor sectors
FOLLOW THE MONEY
Left: who funds Crawford (ribbon width = dollars) · right: their votes on bills classified as favoring vs limiting those sectors
“Favors / limits” is an AI classification of each bill's likely effect on the sector — a factual reading of the bill, not a claim about motive. Correlation, not causation. The named bills are in DOES THE MONEY MATCH THE VOTES? below.
DOES THE MONEY MATCH THE VOTES?
How Crawford voted on bills touching their biggest donor sectors · 6 of 16 shown, ranked by sector money
Each dollar figure is Crawford's total from that donor sector — shown on each related vote, not a per-vote amount. Correlation between funding and votes, not causation; many factors shape any single vote.
TOP SOURCES
1$56K
ARVEST BANK
corporation
2$43K
HERZOG CONTRACTING CORP
employees
3$30K
USA RICE FEDERATION PAC
PAC
4$30K
TRINITY INDUSTRIES EMPLOYEE POLITICAL ACTION COMMITTEE (SF) INC.
PAC
5$30K
NATIONAL CATTLEMEN'S BEEF ASSOCIATION POLITICAL ACTION COMMITTEE (NCBA-PAC)
PAC
ALIGNMENT SIGNALS
COMMITTEES
Transportation and Infrastructure · Vice Chair
Agriculture
House Permanent Select Committee on Intelligence · Chairman
SIMILAR DONOR NETWORKS
Members funded by the same industries — overlapping donor networks may reflect shared policy interests.
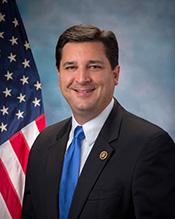
David Rouzer
R-NC · House
AgricultureTransportationConstruction & Engineering
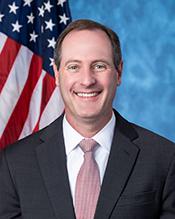
Tracey Mann
R-KS · House
AgricultureTransportationConstruction & Engineering
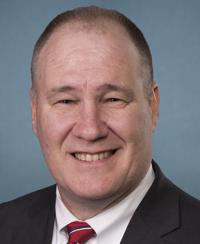
Trent Kelly
R-MS · House
AgricultureConstruction & EngineeringDefense & Aerospace
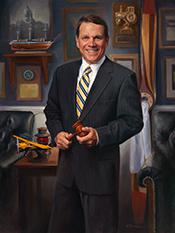
Sam Graves
R-MO · House
TransportationConstruction & EngineeringDefense & Aerospace
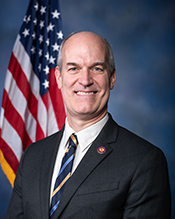
Rick Larsen
D-WA · House
TransportationConstruction & EngineeringDefense & Aerospace
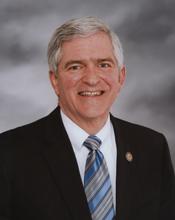
Daniel Webster
R-FL · House
AgricultureTransportationConstruction & Engineering