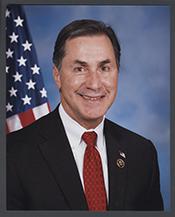
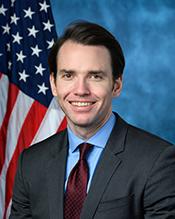
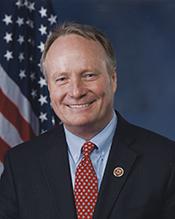
Palmer's fundraising profile relies moderately on PAC and committee money at 40 percent of his $3.6M total, with the remaining 60 percent drawn from individual donors across a 1,752-contribution base. Industry-tied contributions show concentration in construction and engineering (13 percent), lawyers and lobbyists (11 percent), and mining and materials (9 percent), with individual donors employed in construction, legal services, and securities and investment sectors. His voting record spans 336 recorded votes, accompanied by 141 stock trade disclosures filed under the STOCK Act.
Raised · all cycles$3.6M▲ 58% in ’24 vs ’22#136 in party · by cycle ↴
Top sector share13%Construction & Engineering
Donor-sector votes17on bills touching top donor sectors
FOLLOW THE MONEY
Left: who funds Palmer (ribbon width = dollars) · right: their votes on bills classified as favoring vs limiting those sectors
“Favors / limits” is an AI classification of each bill's likely effect on the sector — a factual reading of the bill, not a claim about motive. Correlation, not causation. The named bills are in DOES THE MONEY MATCH THE VOTES? below.
DOES THE MONEY MATCH THE VOTES?
How Palmer voted on bills touching their biggest donor sectors · 6 of 17 shown, ranked by sector money
Each dollar figure is Palmer's total from that donor sector — shown on each related vote, not a per-vote amount. Correlation between funding and votes, not causation; many factors shape any single vote.
TOP SOURCES
1
HAMMER LGC
employees
$43K
2
ELCAN AND ASSOCIATES INC.
employees
$43K
3
REGIONS FINANCIAL CORPORATION POLITICAL ACTION COMMITTEE
PAC
$30K
4
DRUMMOND COMPANY, INC. POLITICAL ACTION COMMITTEE (DPAC)
The industries that fund Palmer's campaign also pay lobbyists to influence the bills Palmer votes on. This filters all lobbying filings down to those donor sectors.
169,685
overlapping filings
$27.3B
reported spend
8
donor industries
2017–2026
years covered
LOBBYING BY DONOR INDUSTRY
Bar = reported lobbying spend in each sector that also funds Palmer
Health Services · 84,196 filings$9.0B
Health Services $9.0B · 84,196 filings
Securities & Investment · 34,497 filings$7.6B
Securities & Investment $7.6B · 34,497 filings
Oil & Gas · 29,992 filings$6.1B
Oil & Gas $6.1B · 29,992 filings
Insurance · 8,743 filings$2.2B
Insurance $2.2B · 8,743 filings
Real Estate · 10,564 filings$1.4B
Real Estate $1.4B · 10,564 filings
Legal Services · 1,693 filings$1.1B
Legal Services $1.1B · 1,693 filings
SPEND BY YEAR
TOP FIRMS
1
WASTE MANAGEMENT, INC.
10 filings
$1.0B
2
CHAMBER OF COMMERCE OF THE U.S.A.
26 filings
$462.2M
3
NATIONAL ASSOCIATION OF REALTORS
23 filings
$353.6M
4
PHARMACEUTICAL RESEARCH AND MANUFACTURERS OF AMERICA
23 filings
$177.7M
5
THE BUSINESS ROUNDTABLE, INC.
26 filings
$158.1M
6
AMERICAN MEDICAL ASSOCIATION
26 filings
$143.3M
7
AMERICAN HOSPITAL ASSOCIATION
23 filings
$122.8M
8
AMAZON.COM SERVICES LLC
26 filings
$109.8M
ESTIMATED HOLDINGS
~$8K
disclosed range $1K–$15K
$1.1M
volume traded
141
trades
▲ 113
buys
▼ 28
sells
75
issuers
3
filings
The big figure is the estimated current portfolio; volume traded is how much was bought/sold in the window — different things. Holdings start from his 2025 annual disclosure, rolled forward by trades since · midpoint of a wide disclosed range.
TRADING ACTIVITY
Buys ▲ above the line · sells ▼ below · every bar labeled
⤓ axis clipped so the outlier doesn't flatten every other bar — slashed bars exceed the scale; their labels show the true amount
▲ Buys▼ Sells
HOLDINGS
Disclosed positions, adjusted for trades since the last annual filing
TICKERCOMPANYSECTOREST. VALUE
WBDWarner Bros. Discovery, Inc. - Series ACommunication~$8K
MOST TRADED
By trade count · the number in each segment = buys / sells · $ = summed disclosed range
CCPCare Capital Properties, Inc.Jun 26, 2017Jun 26, 20170d▲ BuySPOUSE$1K–$15K
CVIP CVR Energy Inc.Jun 26, 2017Jun 26, 20170d▲ Buy$1K–$15K
Showing 100 of 141 — narrow the window to see more.
HOW WE ESTIMATE THIS
Estimated holdings start from the 2025 annual financial disclosure (each stock listed as a value range), rolled forward by trades disclosed since.
Everything is a range or estimate. The STOCK Act requires only broad dollar brackets (e.g. "$1,001–$15,000"), never exact amounts, share counts, or prices. Figures shown are midpoints.
"Filed after" is the gap between the trade and its disclosure. Over 45 days (⚠) is outside the STOCK Act's filing window.
Source. U.S. House Clerk periodic transaction reports & annual financial disclosures (public record). Not real-time; profit/loss can't be computed from disclosures.